
Use Sophos Firewall Log Viewer correctly
In SFOS 22, Log Viewer is often the fastest starting point for an incident: Which firewall rule handled the traffic, which NAT rule was involved, which user was identified, and which security module blocked it? To get the right answer, the module, time range, filters, and timing of the log entry must match.
Log Viewer shows logged events. It is not Packet Capture and not a complete connection history. A missing entry therefore proves neither a drop nor that the packet reached the firewall.
For reliable analysis, always record the source, destination, service, exact test time, and expected direction. Then create exactly one new test flow and search for it in the relevant modules.
Evaluate a test in seven steps
- In the affected firewall rule, check Log firewall traffic, or Log connections in the SSL/TLS rule.
- Under System services > Log settings, make sure the required log type is enabled under Local reporting.
- Open Log viewer (SFOS 22) or Logs and policy test (SFOS 23) in the upper-right corner of WebAdmin, then select the relevant log module.
- Set the time filter and use Add filter to narrow the view first by source IP, destination IP, and service.
- Create a new, short test flow and record its exact time.
- In Detailed view, check Rule ID, NAT ID, action, interfaces, user, and module-specific fields.
- If the entry and observed behavior do not match, correlate the same test with Packet Capture before changing a rule.
This sequence separates three questions that are often mixed together: Was a log created at all? Which policy made the decision? And did the packets actually enter and leave again?
Read log entries correctly
Why log entries do not always appear immediately
Log Viewer refreshes the display automatically. A firewall session, however, is normally logged only when the firewall receives a Destroy event and closes the connection. With a long-running session, the log can therefore appear later than the first request.
If a connection ends without the firewall receiving a Destroy event, for example during loss of internet connectivity, the expected session log may be missing entirely. SSL/TLS connections are logged after a successful handshake and when they close. For a short test, a deliberately closed connection is therefore better than a permanently open browser, streaming, or HTTP/2 session.
A browser refresh does not necessarily create a new connection. Depending on the application, a private browser window, a restarted client process, or a short request such as the following is suitable for a reproducible test:
curl -I https://example.com/
Run the command on the test client, not in the firewall shell. example.com is a reserved example domain and can be replaced with a known, allowed service.
Select the right module
A traffic flow can touch several log modules. The Firewall module may show that a LAN-to-WAN rule allowed the connection, while Web filter, Application filter, IPS, or SSL/TLS inspection later blocks or otherwise handles the same flow.
For that reason, one green firewall entry is not sufficient for web or security problems. Correlate the modules for the same test flow using the test period and addresses:
- Firewall: Rule decision, NAT, interfaces, ports, and basic connection status.
- Web filter: URL, category, and web policy decisions.
- SSL/TLS inspection: Certificate, handshake, and decryption decisions.
- Application filter: Identified application and Application Control action.
- IPS: Signature or anomaly events.
- VPN: Establishment and status of the relevant VPN component.
- Authentication: Identified user and successful or failed authentication.
- System: System and administrator-triggered events.
- SD-WAN: SD-WAN profile, SLA, and route usage.
Which log types appear locally is configured under System services > Log settings in Local reporting. These event logs are not the same as on-box reports. Central reporting and syslog are separate destinations and must be enabled independently. Web policy events also require Log firewall traffic in the associated firewall rule. Wireless logs aren’t available in Log Viewer; send them to Sophos Fusion (formerly Sophos Central) or a syslog server instead.
Web proxy boundary: For HTTP and HTTPS traffic on ports 80 and 443, a matching firewall rule with
Droppasses the flow to the web proxy. Without a matching web exception, the Firewall log then shows Allowed, while the Web filter log shows Blocked. Configured web exceptions still apply, so a request may be allowed despiteDrop.Rejectinstead terminates the flow before proxy processing. Always review the firewall rule, web policy, and web exceptions together.
Allow rule and missing heartbeat
A different case from Drop occurs when the firewall rule that actually matches has Action Allow, Block clients with no Heartbeat is enabled, and the endpoint sends no heartbeat. Log firewall traffic must be enabled in that rule for the log observations described here. Before searching, also check the required log types under System services > Log settings > Local reporting; enabling an external log destination alone is not sufficient for the local view.
- Ports other than 80 and 443: The firewall drops this endpoint’s packets. The Firewall log shows dropped.
- Ports 80 and 443 in the documented web proxy path: The firewall accepts incoming packets and passes them to the web proxy. Because the endpoint sends no heartbeat, the heartbeat system decides to block; the proxy sends the user a block page. The Firewall log shows allowed, another Firewall log shows Heartbeat blocked, and the Web filter log shows blocked. Here, Heartbeat blocked therefore also belongs to the Firewall module, not a separate heartbeat log module.
Allowed alone does not prove successful access. Before changing a rule, correlate entries for the same test flow: review the test period, source and destination, ports, and matching rule together. Look for the separate Heartbeat blocked entry and the Web filter entry showing blocked. This does not require a fixed event order, identical timestamps, or a universal number of log rows; if expected entries are missing, first check logging, local destinations, and filters, and use Packet Capture if needed.
This interpretation applies to this exact rule option, an endpoint without a heartbeat, and the described proxy path. It is not a general statement about every Allow rule, red or otherwise unhealthy endpoints, or other inspection modes. Do not disable heartbeat enforcement as a generic fix; first establish the rule match and why the heartbeat is missing.
Distinguish Standard view and Detailed view
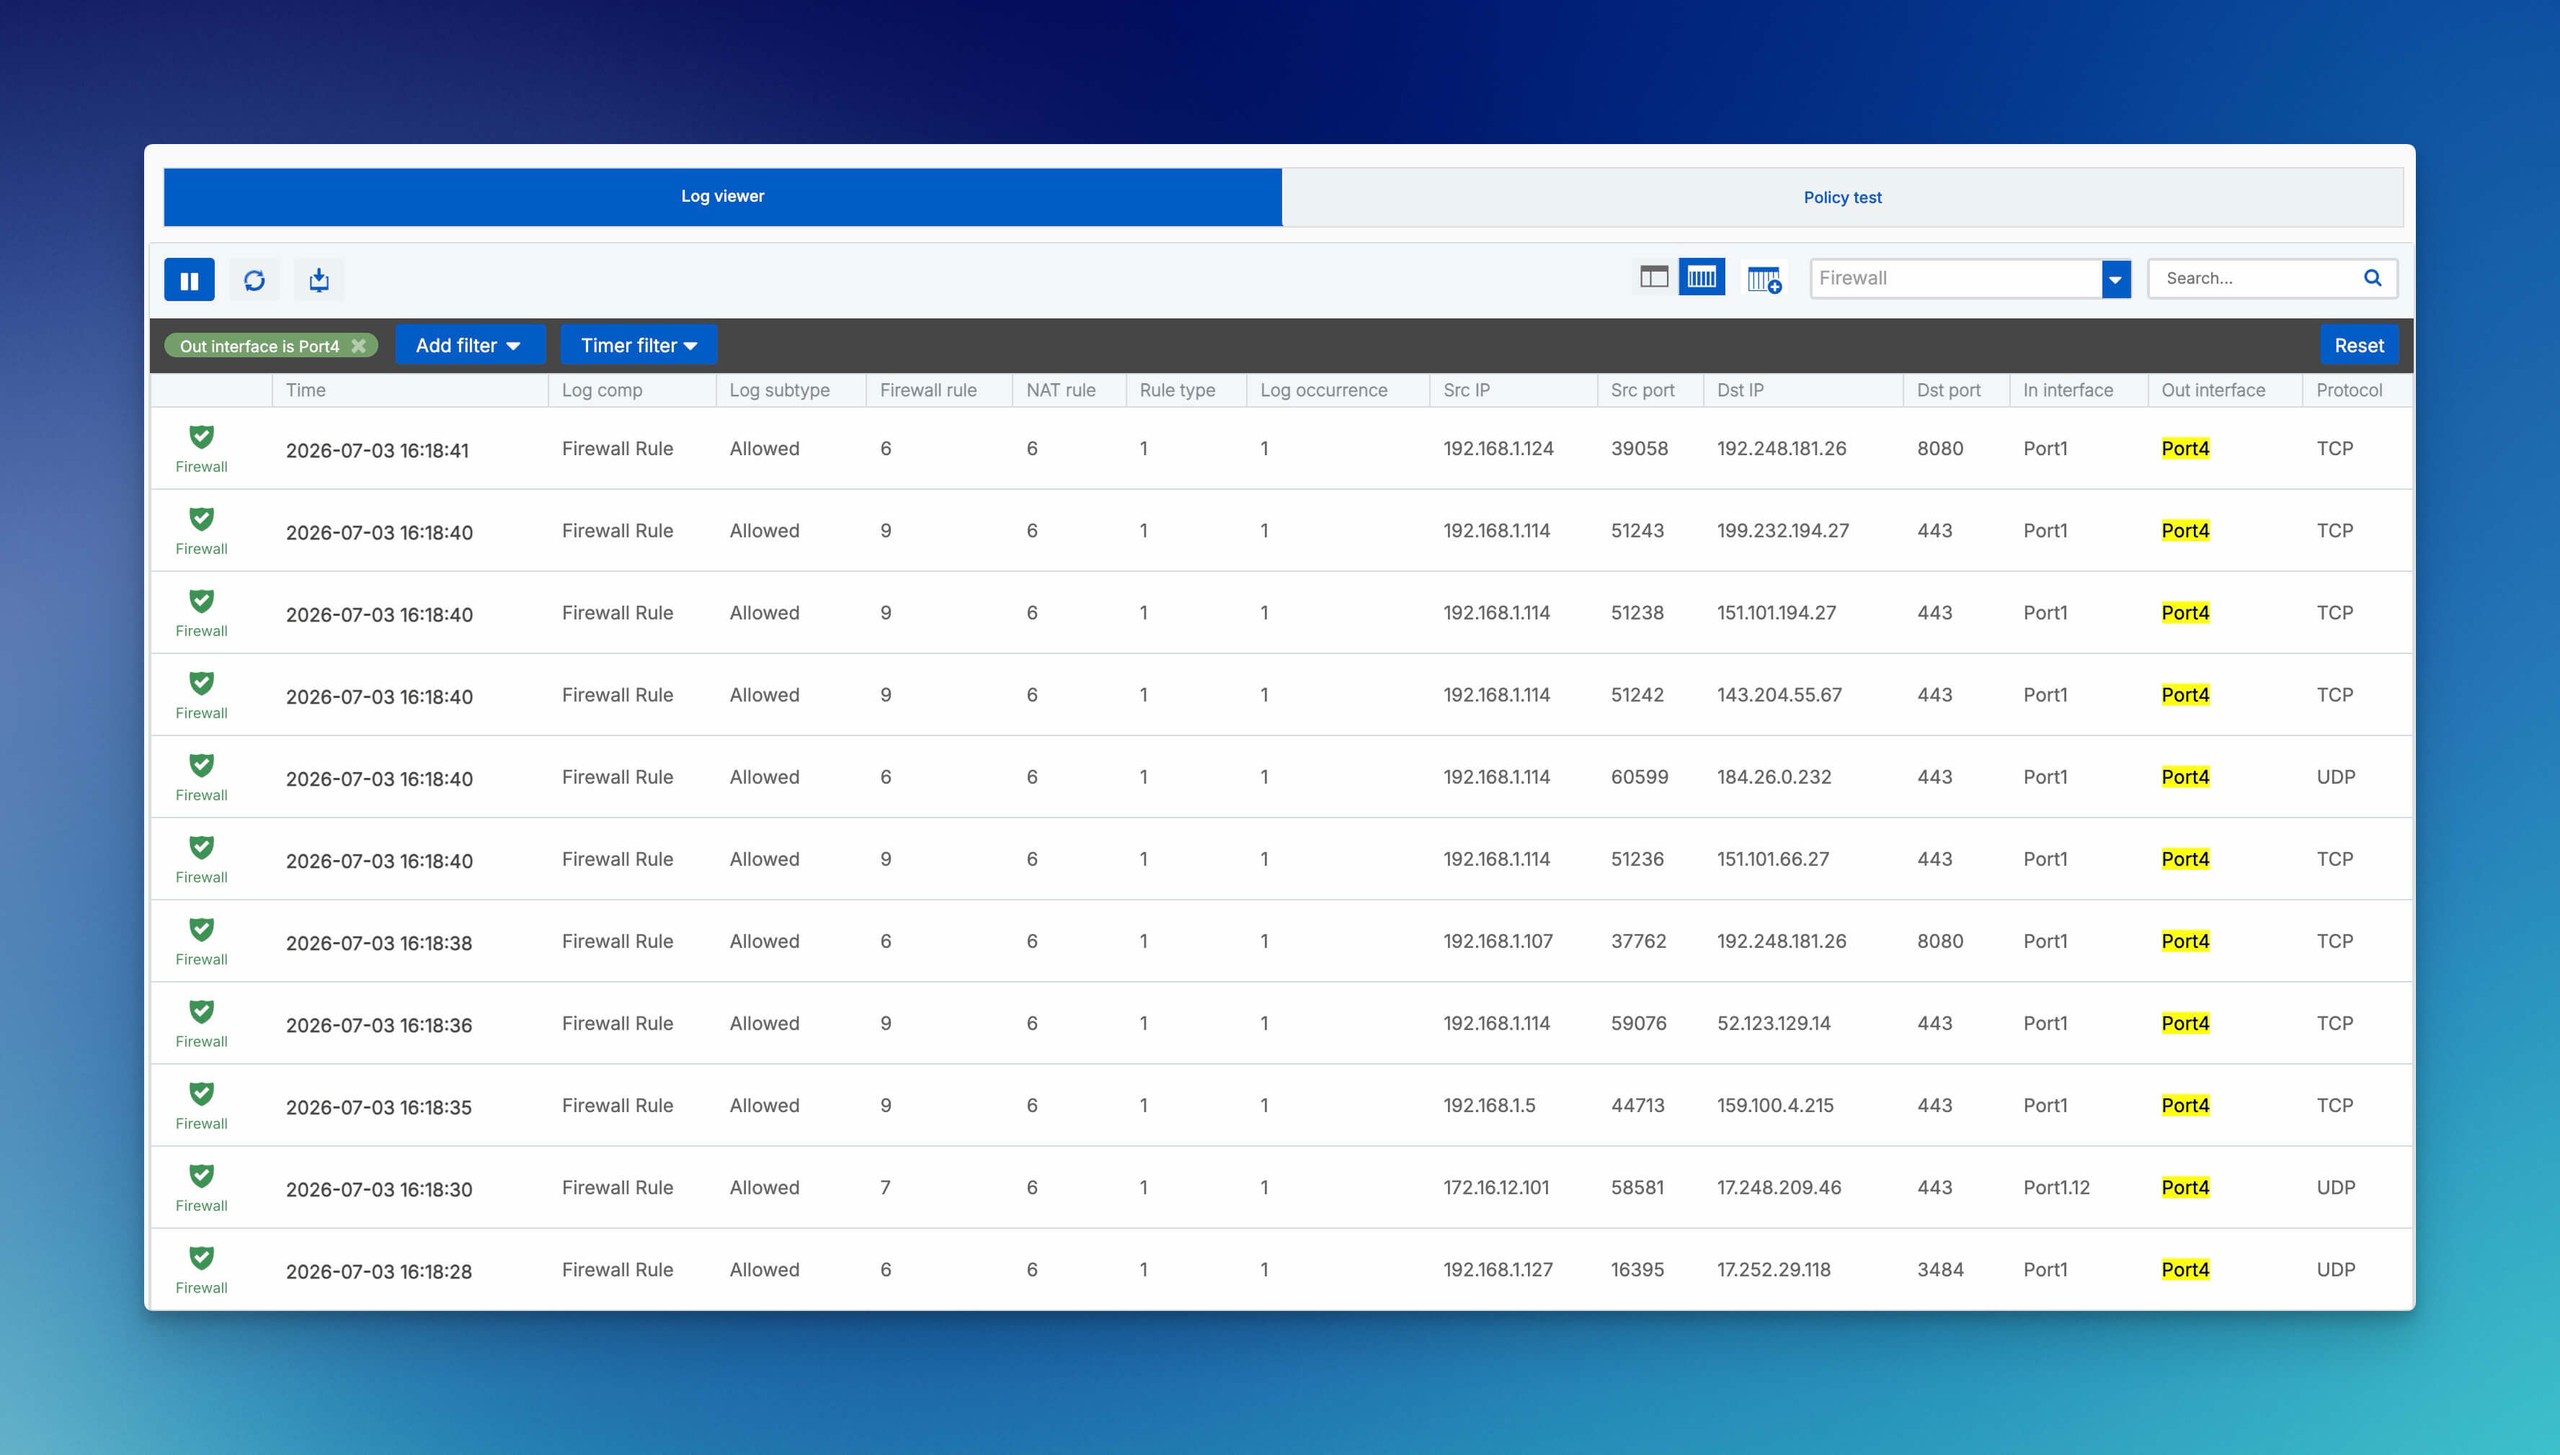
Standard view is useful for quick reading. Columns can be added or removed, and clicking a value can use it directly as a filter. For technical acceptance, Detailed view is more important because it shows the underlying field names and additional values.
One important NAT detail: If a translated source address other than the default MASQ address is used, Standard view can still show the MASQ address as the outgoing address. The actual translated source appears in Detailed view in src_trans_ip.
Typical fields for a firewall test include:
- Source and destination IP, and source and destination port
- In interface and Out interface
- Firewall Rule ID and NAT Rule ID
- Action or status
- Username, if an identity was detected
- Translated source and destination
- Log component and Log subtype
A field name or ID does not automatically explain the cause. Compare the Rule ID with the current rule base, the NAT ID with the corresponding NAT rule, and a security policy ID with its module.
If a packet capture is running at the same time under Diagnostics > Packet capture, Open PCAP on the matching log entry can open the associated packet information. This connects the logged decision with packet details, but it does not replace a narrowly scoped capture filter: source, destination, port, and test time must still match the flow being investigated.
Isolate the correct flow
Set filters so that only the correct flow remains
Log Viewer provides four filtering levels:
- Module: Limits the view to Firewall, Web, IPS, VPN, or another area.
- Time: Limits events to the test period.
- Add filter: Combines a specific field, condition, and value.
- Free text search: Searches for ports, IP addresses, users, or rule names, for example, and also works with anonymized information.
For a normal connection test, start with source IP, destination IP, and destination port. Then narrow further with Rule ID, user, or action. Reset clears all filters. This matters because an old time or field filter can easily create the impression that the viewer is no longer receiving events.
The number of available entries depends on disk size and local retention. Log Viewer is therefore not a replacement for long-term, tamper-resistant storage. For that, use Central Firewall Reporting or Send syslog to a SIEM.
Use Pause, Refresh, and CSV export correctly
Pause stops automatic display refresh. It is useful when a row must be read or copied without moving. It does not stop logging on the firewall. Refresh reloads the view manually, and Export downloads the currently available logs as CSV.
Before exporting, document the module, time range, and filters. The CSV may contain internal IP addresses, usernames, URLs, and communication relationships, so it belongs in a protected support or analysis workflow.
When Data anonymization is enabled, identifying values such as usernames, IP, MAC, and email addresses are shown in protected form. Sophos recommends at least two authorizers: if the signed-in administrator is one of them, at least one other authorizer must approve deanonymization. A screenshot or export should still contain only the rows required for the case.
Understand Log suppression and Log occurrence
Under System services > Log settings, the firewall can suppress consecutive, identical firewall events. This saves storage and processing. Suppression affects not only local logs but also Sophos Fusion and configured syslog destinations.
In Log Viewer, Log occurrence shows how often a summarized event occurred. One row can therefore represent many repetitions. It must not automatically be counted as one packet or one connection.
Before changing Log suppression, check whether the current log volume is actually causing a problem. For a short diagnosis, consciously reading Log occurrence is usually sufficient. A global change also affects external log destinations and should not be made only to produce a screenshot.
Interpret findings safely
Interpret Invalid traffic correctly
Invalid traffic means that conntrack could not associate a packet with a current connection. This can occur with an asymmetric path, an expired session, unexpected TCP flags, or additional RST and FIN packets. It is not automatically an attack or a firewall defect.
If a connection problem occurs at the same time, capture both directions with Packet Capture. Source, destination, TCP flags, interfaces, and timestamps must belong to the same flow. Increasing Tcp Connection Establishment Idle Timeout may reduce the number of such logs, but it does not resolve the underlying path or session cause. Do not change the value speculatively.
The read-only command show advanced-firewall in the Device Console shows the current global value; Sophos documents 10800 seconds, or three hours, as the default. A change affects all corresponding TCP sessions on the firewall. First correlate the affected application, its actual idle time, and the Invalid traffic event. A higher timeout is a justified operational adjustment only, not a repair for asymmetric routing or packet loss.
The complete drop workflow with Reason, Rule ID, and the special Firewall ID 0 is described in Analyze dropped packets on Sophos Firewall.
Modify rules from Log Viewer only in a controlled way
Depending on the event, Log Viewer can open web policies, firewall rules, or SSL/TLS rules directly. This is convenient, but it does not shorten the technical check. Before editing, verify the Rule ID, rule name, position, zones, objects, service, user match, and existing sessions; also record the current values of the fields you will change for rollback.
For SSL/TLS events, Manage > Exclude leads to different configuration targets depending on the match: domains and subdomains go into the Local TLS exclusion list, web categories into the exclusions of the selected SSL/TLS rule, and other properties into an SSL/TLS rule with suitable user or IP objects. Log Viewer does not offer Exclude for error IDs 19004 and 19005.
Clicking an IPS Signature ID can offer Disable signature for this IPS policy. This changes the active IPS policy, not just the display. Document the affected rule, policy, signature, protection impact, and scope of the exception first, then retest exactly the confirmed flow.
A broad allow rule, global web exception, or disabled TLS inspection can hide the symptom while creating a new security gap. Limit changes to the confirmed flow, test them in a maintenance window, and validate a new flow again in Log Viewer and, if necessary, Packet Capture. If the test fails or the exception is too broad, restore the previously recorded state in the linked rule or policy object and test again with a new flow.
When logs are missing or stored on the other HA node
When expected logs are missing
Check an empty result in this order:
- Check Pause, module, time range, and filters, then use Reset and Refresh.
- Check rule logging and Local reporting for the required log type.
- Create a new, deliberately closed connection with a known timestamp.
- Use Packet Capture to confirm that traffic reaches the firewall and which Rule ID handles it.
- Check other modules for events belonging to the same flow.
- Only investigate the viewer or logging service path if the entire local view receives no new events.
The version-specific diagnostic workflow for a completely stalled viewer is described in Log Viewer shows no new logs. A service restart or intervention in the local log database is not part of normal usage.
Log Viewer in HA environments
Each HA node stores only the logs and reports for traffic that it handled. Especially in active-active mode or after a failover, the expected entry may therefore be on the other node. Document the time, node role, and Connection served by together.
Central Firewall Reporting or syslog can provide a central view. They do not replace the node-specific check when investigating a particular HA role change, local service failure, or the traffic path at the time of the event.
Why does an allowed connection appear later in Log Viewer?
Destroy event when the connection ends. A long-running or reused session can therefore appear late. Create a new, short, and deliberately closed connection for the test.